Was 2015 Boston's worst winter yet?
Sorry, '78. A look at the data reveals that 2015 was by far the worst winter in the history of the city.
Prior to moving this page from my MIT hosting: 
March 15, 2015
If you've spoken to a New Englander about winter weather in the last 30 years, at one point you almost certainly heard the phrase, "Back in '78..." The Blizzard of '78 brought Boston to its knees, and has been the city's premier weather event ever since. Midway through this last February, I was out shoveling snow when my neighbor made a shocking admission: "This is even worse than it was in '78." Could it be?! Had this winter actually surpassed the legendary winter of '78, earning a place as the reference point for all future winters?
The data show that not only did this winter surpass 1978, it obliterated its records, and just about all others in the process. This figure shows all you need to know to understand how bad the winter of 2015 really was:
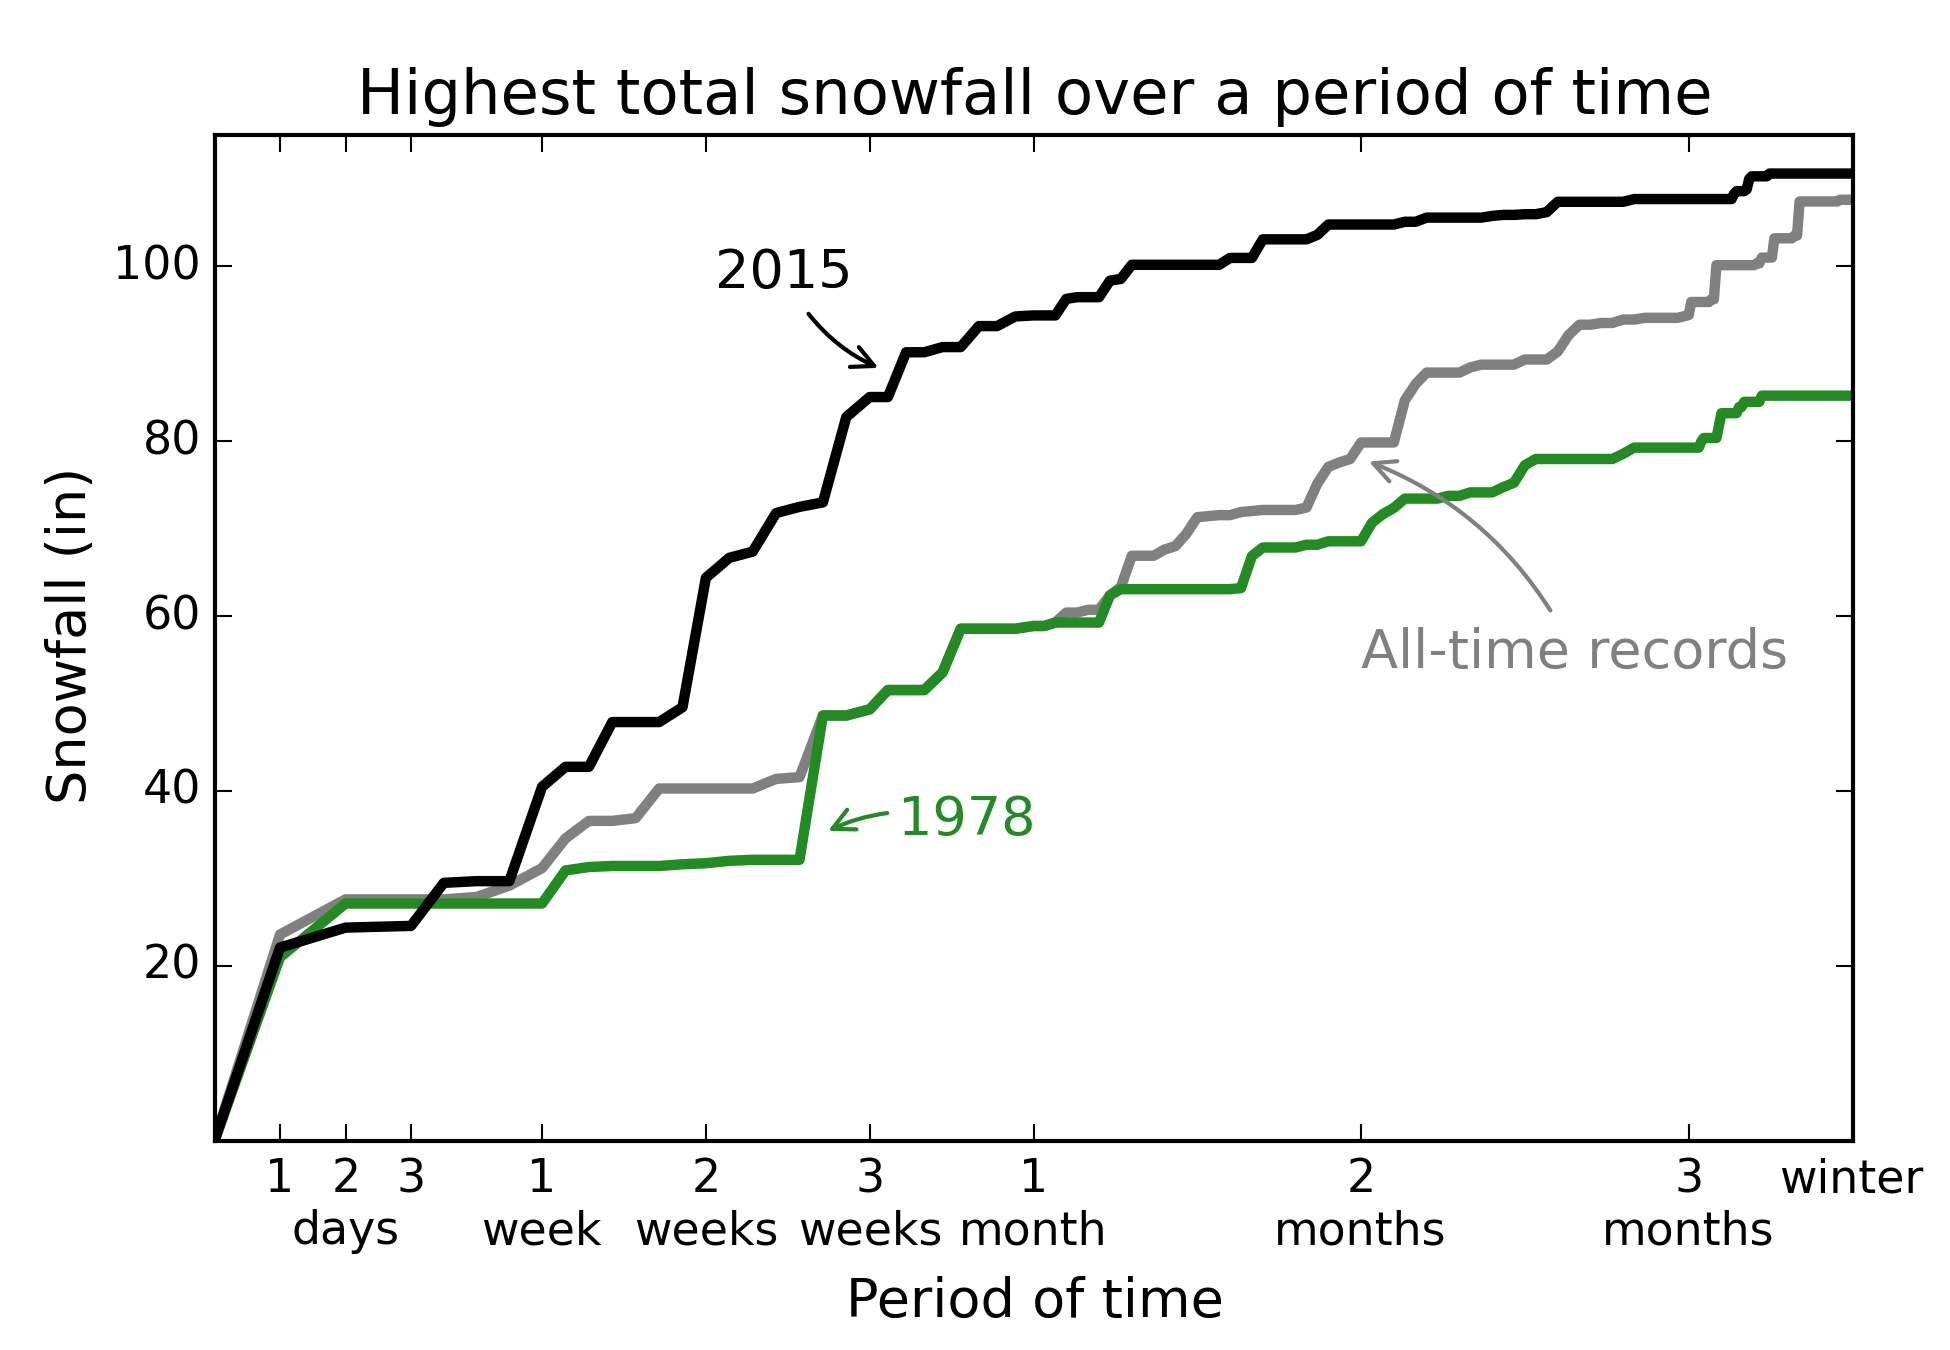
We look through the snowfall data for the winter and ask, "What was the most snow that fell in any period of n days?" This snowfall is shown in the figure for the 2014-15 and 1977-78 winters, with the number of days n varying from 1 to the entire winter. Then, we ask "In the history of Boston, before 2015 what was the most snow that had ever fallen in n days?" This all-time record snowfall for each n is also shown in the figure, using data from NOAA that goes back to 1893 (the last 120 winters).
The figure shows that the winter of 2015 does not hold the record for most snow in any 1, 2, or 3 day period - it's just a few inches short of those records. However, it holds the record for all other periods of time. And it doesn't just hold the record, it smashed the old records. In 2015, we got 94 inches of snow in just one month, compared to the previous record (set in 1978) of 59 inches. To put that into perspective, the average annual snowfall for Boston is 41 inches. In 2015, we beat 1978's one month record by almost an entire year's worth of snow!
The Blizzard of '78 set the 1, 2, and 3 day snowfall records at the time. Those records have been broken, most recently by a major storm in 2003. The all-time records in the figure come from six previous winters: 1978, 1994, 1996, 2003, 2005, and 2011. After 2015, there are now only two winters with snowfall-per-period records: 2003 for 1, 2, and 3 days, and 2015 for everything else. Sorry, '78.
A big part of what made the Blizzard of '78 so bad was a failure of officials and the public to act on the NWS forecast, leaving people stranded on Route 128 during the storm. There wasn't nearly the same mass chaos and destruction this year (except maybe on the T), so the memory of 2015 perhaps won't be quite as bitter. However, the drastically higher snowfalls justify using 2015 as the new reference point for New England winters.
The L-score: a metric for bad winter snowfalls
 What's the right number to describe how bad a winter's snowfall was? One choice might be total snowfall throughout the winter. However, a large amount of snow spread throughout the winter doesn't cause quite the same difficulty as slightly less snow concentrated in one month. Another choice might be the most snow in any one day. This captures the misery of that one day, but what if it was the only big storm that year? These two choices are the right and left edges of the curves in the above figure, respectively. So let's design a metric that takes into account the whole curve, thus measuring the snowfalls across all time scales - one day, the whole winter, and everything in between. We do this by measuring the area under the curves above - see here for the details.
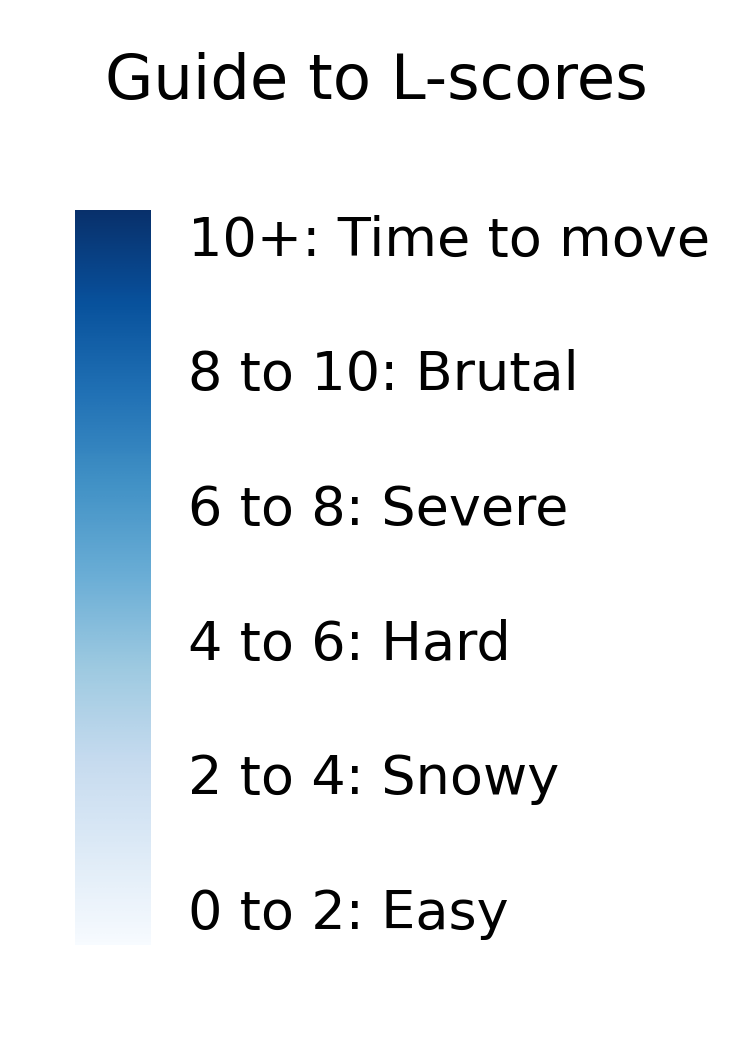
The result is called the L-score, and is scaled so that a winter with no snow has an L-score of 0 and 2015 in Boston had an L-score of 10. The guide on the right gives the interpretation of the various ranges of L-scores.
Now that we have a metric for how bad the snowfall in a winter was, what were the worst winters in the history of Boston? These are the worst 10 in the last 120 years that we have data for:
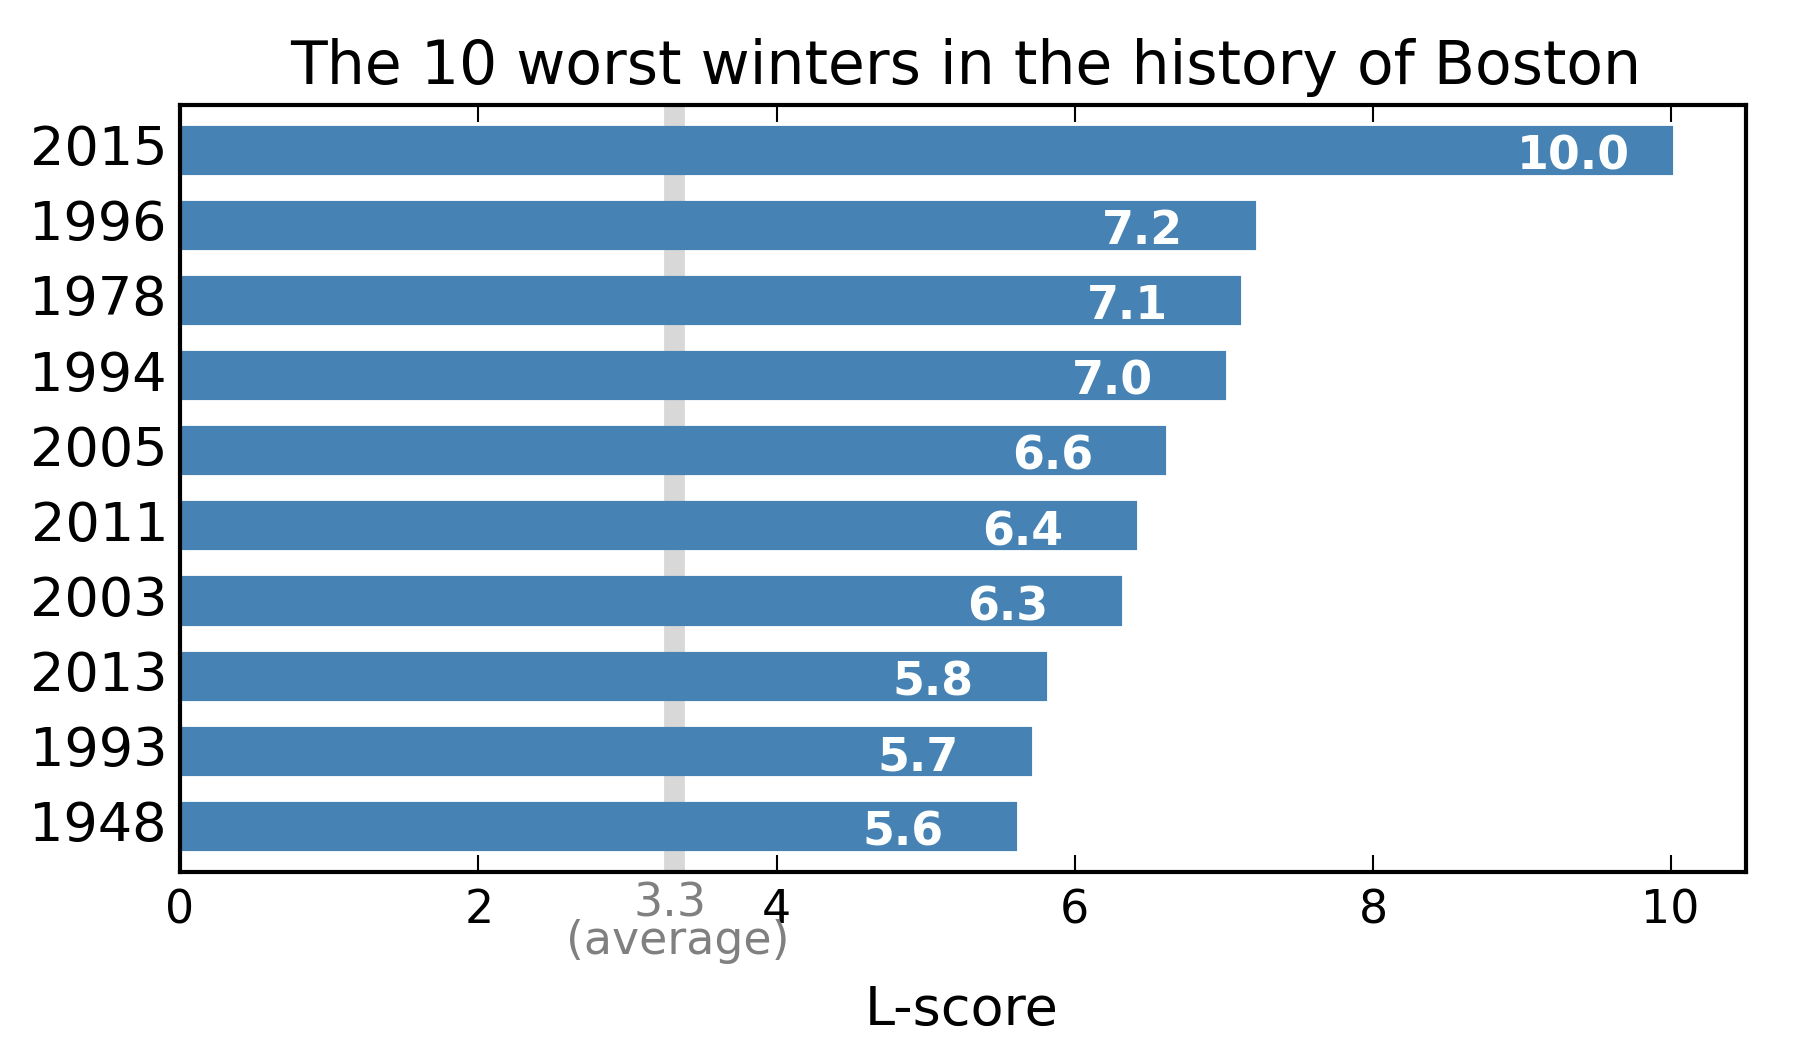
1978 comes in as the third worst winter in the history of Boston, just a hair behind 1996, which held the most-snowfall-in-a-winter record until 2015. It is also one of only six "severe" winters in the last 120 years. These winters were really rough (the average L-score in Boston is only 3.3, "snowy"), but they pale in comparison to the "brutal" winter of 2015.
Next we compute the L-score for each of the last 120 Boston winters, and count the historical distribution.
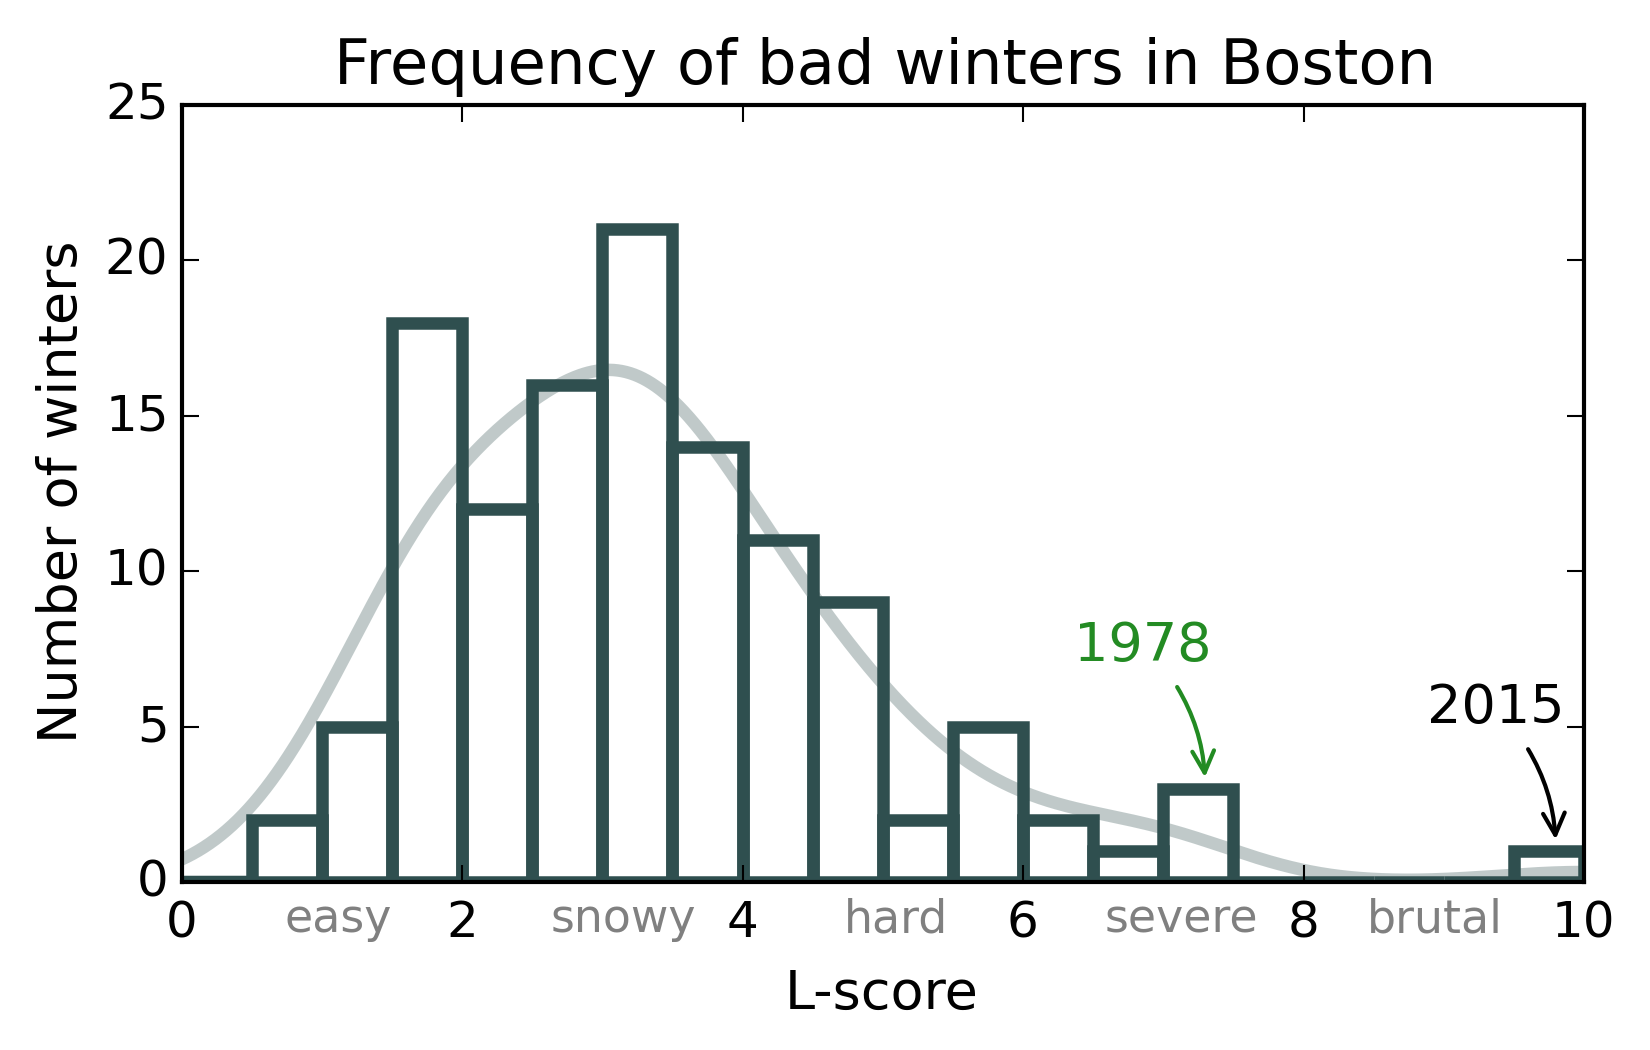
We see that most Boston winters are "snowy", with more "hard" winters than "easy" winters and only rare "severe" winters. Way out on the tail is the only "brutal" winter in the city's history: 2015.
How did Boston's winter 2015 compare to some other U.S. cities?
We can use the L-score to compare the winter in Boston to other notable U.S. cities. Some had it easy, some had it rough, but none had it quite like Boston.
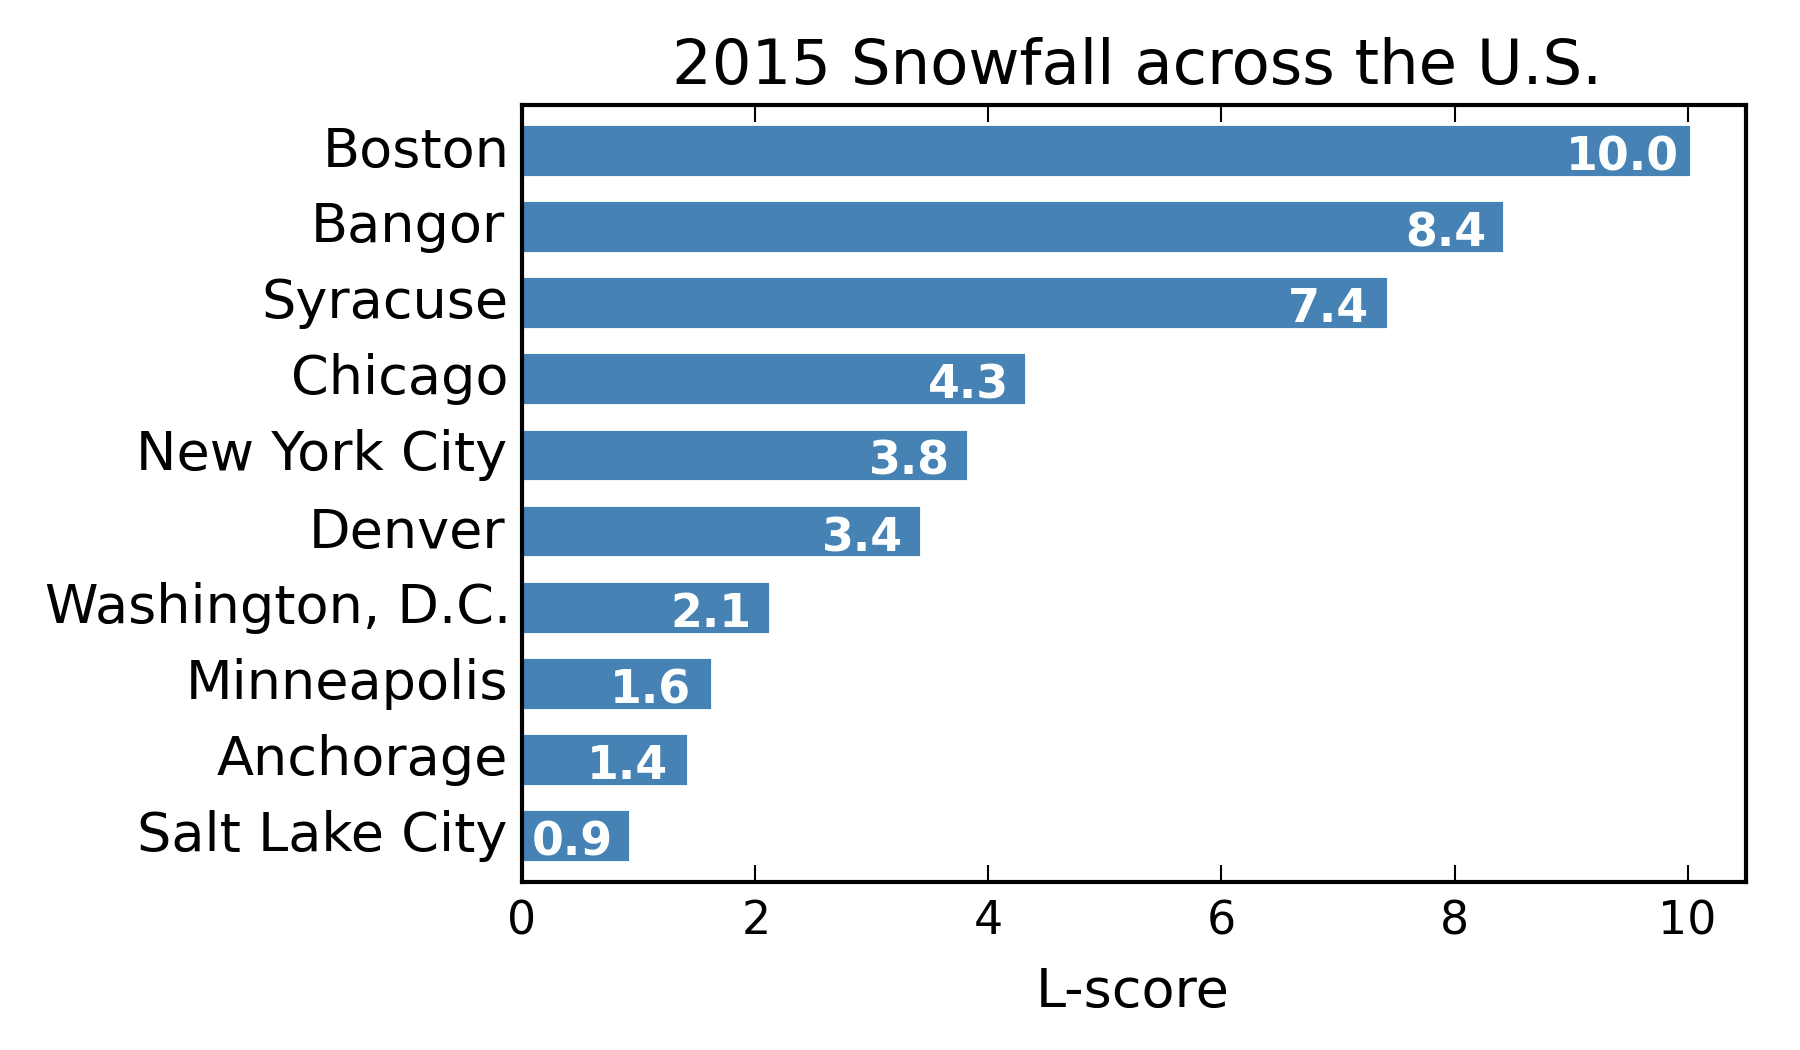
Bangor had a "brutal" winter, but in an unusual turn of events, Boston's was worse. Notably, both Bangor and Syracuse (a "severe" winter) had more total snowfall than Boston, but the snowfall was more evenly spread throughout the winter, leading to a lower L-score. For example, the highest 1-day snowfall in Syracuse was only 11.8 inches, which was half of Boston's 1-day total.
A "snowy" winter is a big deal for Washington D.C., but an "easy" winter for Anchorage...
Looking forward
The good news for Boston is that 2015 was really unusual. The "Frequency of bad winters in Boston" figure shows that this winter was a real outlier from the last 120 years. It actually was a once-in-a-century winter, which is good news for Boston, because it means we probably won't see another winter like this in our lifetimes. Bostonians won't be talking about the winter of 2015 for the next thirty years - they'll be talking about it for the next hundred.
Comments? Email me at bletham@gmail.com.
Addendum: You may have noticed that 8 of the top 10 worst winters from the last 120 years took place within the last 25 years. Does this mean that Boston winters are getting worse and we can expect a winter like 2015 to become the norm? Probably not - I investigate this question in a post here.
Addendum: Boston had the worst snowfalls of any major metro area in the U.S., but some smaller towns had it much worse. The Buffalo area in particular was hit with a nasty storm in November. The snowfall was extremely localized, so while Buffalo itself (as measured at the airport) got only 17 inches, nearby towns got several feet. Here is a map showing the L-scores for some of the towns around Buffalo:
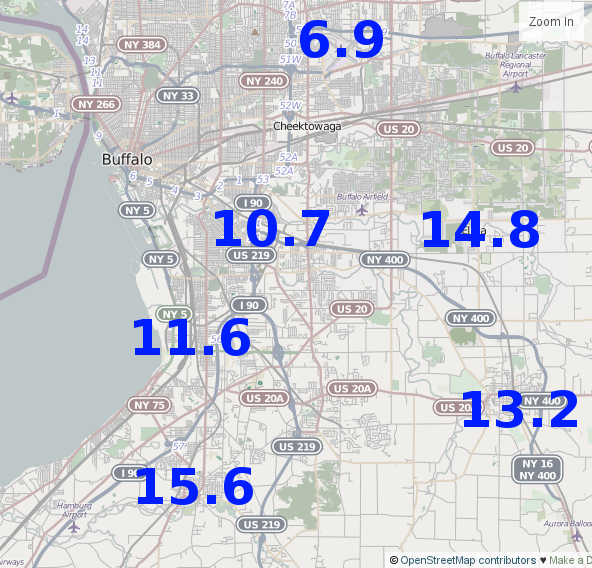
At the airport the L-score was only 6.9 ("severe"), but further south the L-scores were much higher. Hamburg got an incredible 89 inches of snow within two weeks in November, which combined with the rest of winter led to an L-score of 15.6 - "time to move"!
(Map is (c) OpenStreetMap contributors, available under this license.)
Update: I added the word "snowfall" in two places to emphasize that this is an analysis only of the snowfall. Other factors like temperature would be interesting to investigate but are not included here. The snowfall accumulation figure was also updated at the end of the winter to include the additional few inches that fell after March 15.