The L-score for measuring snowfall across multiple time periods
A good metric for the difficulty of snowfall in a winter should incorporate multiple time scales. The L-score is one such metric, and we provide code to compute it.
March 15, 2015
How do you put a number on how bad a winter's snowfall was? A frequently used number is the total snowfall in the winter. But the amount of snow doesn't tell the whole story - the timing of the snow is also very important. For example, 100 inches of snow spread across the entire winter causes much less difficulty than 100 inches concentrated into a single month. So then how can we incorporate time into our metric?
The core of the metric is the period-accumulation curve. We look at the winter snowfall data and ask "What was the most snow that fell in any period of n days?" We measure this for every time period ranging from n=1 to the entire winter. These are the period-accumulation curves for the last two winters in Boston:
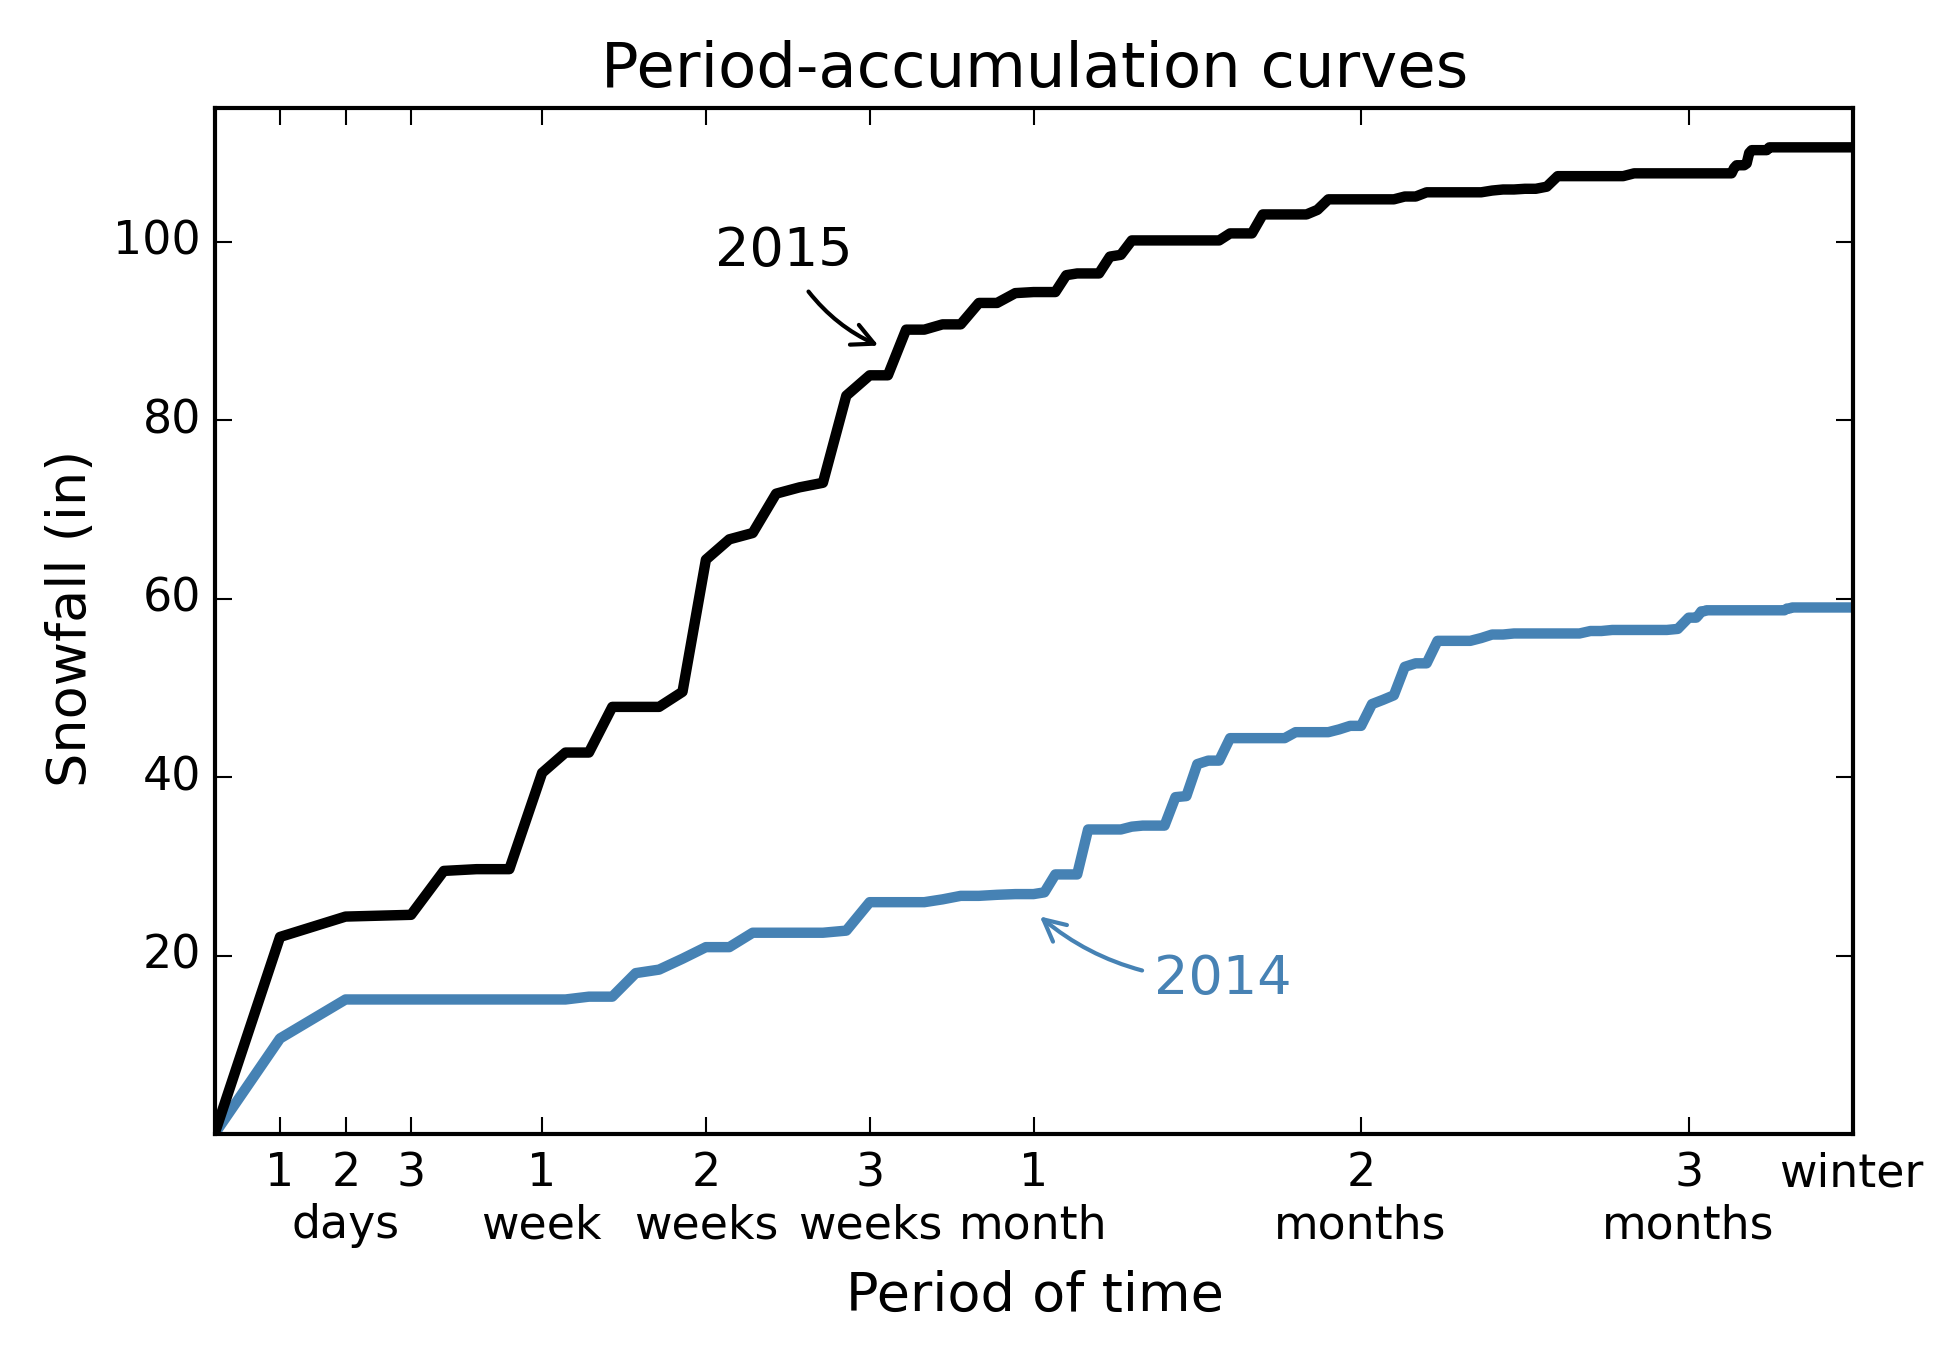
Here "2015" indicates the 2014-15 winter, and "2014" the 2013-14 winter. The x-axis on the above figure has been scaled to give more detail on the shorter time periods, where the curves are more dynamic. The period-accumulation curve shows the snow accumulation measured over all time periods. It leads naturally to a way of measuring snow accumulation across all time periods - the area under the period-accumulation curve. This is done after applying a log-scale to the x-axis, which focuses the metric on the shorter, more impactful timescales while still including the longer timescales. The unit of the y-axis is set to inches. The area-under-the-curve is computed using the trapezoid rule, with a discretization of 1 day, from 0 to 150 days. This number is then divided by 29.73, which scales the metric so that it equals 0 in a year with no snow, and equaled 10 in Boston in 2015 (Boston's worst winter on record).
We call this metric the Multi-Period Snow Accumulation Score. This is shortened to the L-score, since the letter L is the average of the letters MPSA (using each letter's position in the English alphabet), and MPSA-score is a bit of a mouthful.
Python code for computing the L-score from daily snowfall data (such as that available from the NOAA National Climatic Data Center for any city in the U.S.) is available here. In this post the L-score is applied to snowfall data from Boston to show that 2015 was by far the worst winter in the history of the city.
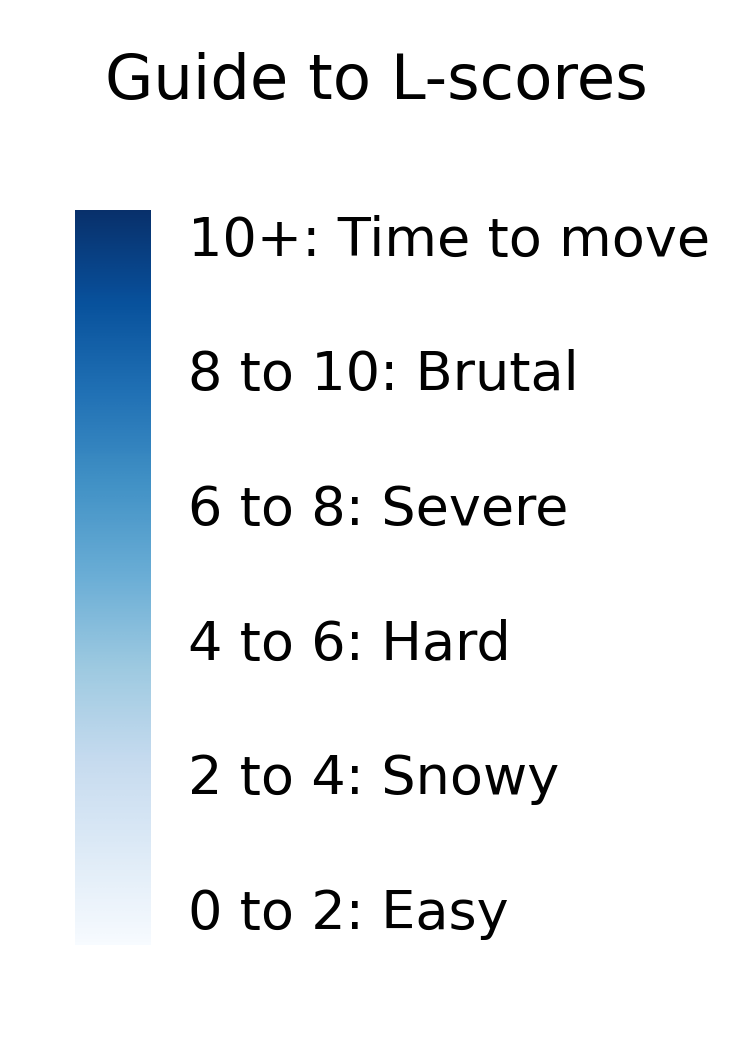
Finally, here is a useful guide for interpreting L-score values:
Comments? Email me at bletham@gmail.com.
Update: The period-accumulation curve and L-score scaling factor were updated at the end of the winter to include the additional few inches that fell after March 15.